Archives of Community Medicine and Public Health
Social-oriented, evidence-based Covid-19 prevention using GIS
Olaf C Jensen*
Cite this as
Jensen OC (2020) Social-oriented, evidence-based Covid-19 prevention using GIS. Arch Community Med Public Health 6(2): 176-178. DOI: 10.17352/2455-5479.000101Covid-19 has a socially skewed impact and prevention must be tailored specifically accordingly. The purpose is to implement an area-specific, social-oriented prevention in residential areas, slums, etc. based on epidemiological data from well-defined samples of the population.
Methods: Data for calculating the incidence rates and prevalence rates are collected like for an epidemiological study intervention. Local councils of each district and streets with its local characteristics, such as slum, business districts, industrial, etc. implement the data collection and assistance together with experts from ministries and universities.
Results: With valid epidemiological data as the background, the prevention is implemented in the barriers with the highest risks. Local councils of each district of the city implement data collection and plan prevention together with experts from ministries and universities.
Conclusion: By taking Covid-19 prevention into a scientific epidemiological context using the spatial distribution Geographic Information Systems (GIS) of the incidence - and prevalence rates, an effective social-oriented prevention is achieved.
Introduction
Some provinces in Panama with low Covid-19 infection rates are now being released for quarantine. The question is whether part of the cities can also be released gradually using scientific, epidemiological calculations of the area-specific risk of infection, disease and death [1,2]. Covid-19 can be characterized as a natural experiment caused by forces beyond the control of scientists [3]. As with all diseases, Covid-19 has a socially unequal effect and prevention must be tailored specifically accordingly [4-6]. The socially skewed distribution of those who attend the health centres affects the validity of the official data from the Ministry of Health. The validity of the cause of death diagnoses must be known as Covid-19 most often has a high co-morbidity [7]. None of the administrative figures from the Ministry of Health for test-positive, hospitalized, death and case fatality rates provide the necessary evidence to be able to organize an area-specific intervention study in the individual city districts. The aim is to implement targeted, area - specific, social-oriented prevention in residential areas, slums, etc. using epidemiological data from well-defined samples from the neighbourhoods and streets of the city [8].
Methods
Incidence rates and prevalence rates are the tools we need to determine the risk and the relative risk in the districts. The unique thing about using epidemiological incidence rates is that they express a risk comparable to results from other streets and neighbourhoods of the city, which the number of new cases of infected, sick and dead cannot be used for. The same method can be used for the large workplaces, including hospital wards for particularly vulnerable patients such as patients with lung diseases and patients on dialysis. The local councils for each neighbourhood and streets in the city with its local characteristics, such as slums, business districts, industrial districts, etc. are involved in carrying out the data collection in selected samples and planning the prevention together with experts from ministries and universities. Data must be collected with the same epidemiological methods for a planned epidemiological intervention study of disease natural history, causes and measuring the impact of efforts. Properly designed and repeated population sampling provides reliable data with mortality, incidence, and prevalence rates that can be used to make informed decisions about disease control strategies. The data collection takes place i.e. by personal visits to samples of citizens in the neighbourhoods and streets with questionnaires during interviews about demographics, illness, symptoms, Covi-19 swap test and probably a blood sample for testing for antibodies. The visit to the houses is repeated throughout the period.
Results
With the epidemiological data as a background the prevention is directed specifically for the neighbourhoods with the highest risks.
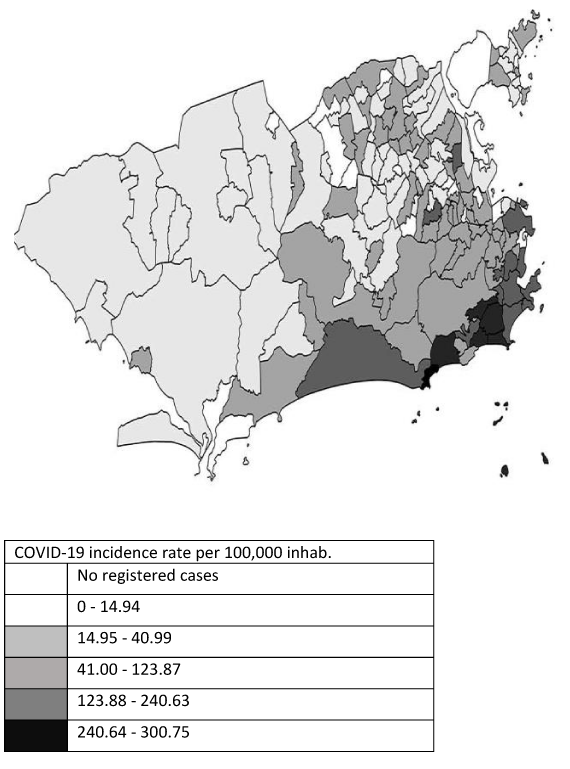
The Covid-19 prevention is made into a scientific epidemiological context with the use of the spatial distribution of the incidence rates with the use of Geographic Information Systems (GIS). The intention is to use the graph of the incidence rates of infected and dead in Rio de Janeiro with the ability to customize differentiated prevention in the most congested social areas in Figure 1 [9]. The collection of data in the same neighbourhoods and streets is repeated every 6 months in order to be able to react to the next waves of infection. Data from the central authorities on social conditions based on incidence rates of dead and infected are used in addition as a background for planning a more comprehensive strategic prevention with improvement of housing.
Discussion
The worldwide response to the COVID-19 pandemic may be the first truly global natural experiment of the modern, big data era. Natural experiments are defined by a shift in exposure that was caused by forces outside the researchers’ control, but which may be used to infer the causal impact of these changes [3]. The cholera epidemic in London in 1854 was a similar natural experiment that led physician John Snow to recognize that cholera was spread through contaminated drinking water [10]. Snow prepared city maps like today’s GIS maps indicating how many dead people were in the houses and calculated the relative risks of cholera death and from where the drinking water came from. Closing the contaminated wells contributed to stopping the course of cholera. City maps indicating the dead in the streets became an Icon of epidemiology as a necessary scientific tool in the prevention and precursor of the modern GIS maps, Figure 2.
Subject to underreporting and insufficient validity, the Covid-19 mortality as of 26 July 2020 was e.g. for Spain 61, Panama 31, Slovenia 5 and Costa Rica 2 per 100,000 population. Despite a marked reduction in poverty and unemployment in recent decades in Panama, in certain areas of Panama City there are relatively poor areas where special assistance has been deployed in this crisis. This is supported by studies from other countries that the poorest are hardest hit and need the most support both financially and health-wise. Experiments using localized quarantine in Israel showed that the poor regions exhibited lower compliance with the restrictions and that individuals from poverty areas were associated with high rates of infection. In addition, interventions that focus on the elderly are the most effective [11]. A study from the USA showed that densely populated areas with air pollution near airports have an increased risk of Covid-19 related mortality [12]. Knowledge, attitudes, and practices of COVID-19 among low-income households in the Philippines showed that more preventive measures were taken by those with more knowledge of potential transmission routes [13]. In a study from San Diego, California based on public health data, COVID-19 mortality was one in rural areas significantly higher for non-English speaking people, people engaged in agricultural work, and people living in poverty. In urban areas, population density was significantly associated with higher COVID 19 mortality [14]. Another study based on publicly available health data in the United States found many counties in the south-eastern states at particular risk for populations with high levels of poverty, co-morbidities, and low levels of insurance coverage [15]. The proposed detailed risk-based considerations and controls on the requirements for opening private and public institutions and workplaces can be applied in the same way.
Conclusion
Consistent with the recommendations of these studies, more resources should be allocated to ongoing epidemiologically based monitoring of infected and dead in the poorest urban areas, in the long run to organize better housing conditions and strengthen research in Covid-19 especially in the poorest areas of the country. By using the spatial distribution Geographic Information Systems (GIS) of the incidence and prevalence rates, an effective Covid-19 social-oriented prevention is achieved in a scientific epidemiological context.
- Bendavid E, Mulaney B, Sood N, Shah S, Ling E, et al. (2020) COVID-19 Antibody Seroprevalence in Santa Clara County, California. medRxiv. Link: https://bit.ly/3atsX1n
- WHO (2020) Population-based age-stratified seroepidemiological investigation protocol for coronavirus 2019 (COVID-19) infection, 26 May 2020. World Health Organization. Link: https://bit.ly/2PMAfU5
- Thomson B (2020) The COVID-19 Pandemic: A Global Natural Experiment. Circulation 142: 14-16. Link: https://bit.ly/3kAMhhv
- Ataguba OA, Ataguba JE (2020) Social determinants of health: the role of effective communication in the COVID-19 pandemic in developing countries. Glob Health Action 13: 1788263. Link: https://bit.ly/30NXXWn
- Bonaccorsi G, Pierri F, Cinelli M, Flori A, Galeazzi A, et al. (2020) Economic and social consequences of human mobility restrictions under COVID-19. Proc Natl Acad Sci U S A 117: 15530-15535. Link: https://bit.ly/30PlJ4c
- Fielding-Miller RK, Sundaram ME, Sundaram K (2020) Social determinants of COVID-19 mortality at the county level. Link: https://bit.ly/2PLNepe
- Baradaran A, Ebrahimzadeh MH, Baradaran A, Kachooei AR (2020) Prevalence of Comorbidities in COVID-19 Patients: A Systematic Review and Meta-Analysis. Arch Bone Jt Surg 8: 247-255. Link: https://bit.ly/3iwlwsJ
- Loaiza JR, Rao K, Eskildsen GA, Ortega-Barria E, Miller MJ, et al. (2020) COVID-19 pandemic in Panama: lessons of the unique risks and research opportunities for Latin America. Rev Panam Salud Publica Pan Am J Public Health 44: e86. Link: https://bit.ly/2PMLOuK
- Cavalcante JR, Lopes de Abreu A (2020) COVID-19 no município do Rio de Janeiro: análise espacial da ocorrência dos primeiros casos e óbitos confirmados. Epidemiol E Serviços Saúde 29. Link: https://bit.ly/31LKqhd
- Cerda LJ, Valdivia CG (2007) John snow, the cholera epidemic and the foundation of modern epidemiology. Rev Chil Infectol 24: 331-334. Link: https://bit.ly/31I2KYT
- Yechezkel M, Weiss A, Rejwan I, Shahmoon E, Gal SB, et al. (2020) Human mobility and poverty as key drivers of COVID-19 transmission and control. Link: https://bit.ly/3ag4ex6
- Correa-Agudelo E, Mersha T, Hernandez A, Branscum AJ, MacKinnon NJ, et al. (2020) Identification of Vulnerable Populations and Areas at Higher Risk of COVID-19 Related Mortality in the U.S. MedRxiv Prepr Serv Health Sci. Link: https://bit.ly/2F76YBt
- Lau LL, Hung N, Go DJ, Ferma J, Choi M, et al. (2020) Knowledge, attitudes and practices of COVID-19 among income-poor households in the Philippines: A cross-sectional study. J Glob Health 10: 011007. Link: https://bit.ly/31I2sRN
- Fielding-Miller RK, Sundaram ME, Brouwer K (2020) Social determinants of COVID-19 mortality at the county level. MedRxiv Prepr Serv Health Sci. Link: https://bit.ly/3aoUGAc
- Chin T, Kahn R, Li R, Chen JT, Krieger N, et al. (2020) U.S. county-level characteristics to inform equitable COVID-19 response. MedRxiv Prepr Serv Health Sci. Link: https://bit.ly/3gR86Hl
Article Alerts
Subscribe to our articles alerts and stay tuned.
 This work is licensed under a Creative Commons Attribution 4.0 International License.


 Save to Mendeley
